
What RFM Analysis Is ー and Why It Works for Retail
Many retail chains that have a loyalty program are accumulating years of transaction records without having any organized method to use them. In fact, in a spreadsheet, all customers roughly look the same unless someone segments them. RFM analysis is the quickest way to remedy that: it converts raw order data into a ranked, actionable chart showing who should be retained, who can be ed, and who has already gone.
RFM analysis retail scores every customer on Recency, Frequency, and Monetary value. Each dimension gets a score from 1 to 5, and the combined three-digit code places every customer into one of 11 actionable segments — from Champions at the top to Lost at the bottom. As DigitalApplied puts it, RFM produces 11 actionable segments from a single orders table, with no ML required.
Retail is arguably the category RFM was built for. Unlike SaaS or subscription businesses, where "usage" is a separate signal from billing, retail has no such split — a purchase and a payment are the same event, and site or store visits are the only behavioral layer on top of it. That means the entire customer relationship is visible directly in transaction and behavioral data, with nothing hidden behind a product-usage black box.
It's the best place to begin at the enterprise level because it requires very few things upfront. No ML pipeline, no data science team, no model training for months RFM works on any transaction dataset that retailers typically have, and the results can be directly used for marketing actions. The benefit of targeting segments instead of sending everyone the same message is already evident from the data: behavior-triggered messages accounted for 30% of email revenue even though they constituted only 2% of send volume in 2025, a disparity that gets even bigger the more accurately the triggers are based on something like RFM segments rather than a single generic list. (Omnisend, 2026)
This guide explains:
The data basics that RFM requires in an enterprise context, unified POS and online, returns taken into account.
Ways to assign scores to a large, diverse customer base without breaking it down into meaningless buckets.
All 11 RFM segments, with a retail-specific action for each.
The main reason for refresh cadence is a business decision, not a technical default.
Ways to complement RFM with behavioral signals other than the transaction itself.
A retail segment-by-segment action plan.
Why RFM analysis loyalty program retail data and RFM complement each other naturally.
What are the common errors of enterprise retail RFM at scale?
Details of how Evinent Analytics operates RFM as a production system.
The Data Requirements: What You Need Before Scoring
Even before calculating an RFM score, the underlying data has to be stable enough for enterprise-level operations, a completely different standard compared to a single-storefront setup. Nailing this comes down to basically three elements: bringing transaction data in line, focusing on loyalty data as the mainstay rather than being an add-on, and performing a few quality checks that most teams neglect until a problem arises.
Start With a Single View of the Transaction
The whole thing really depends on having one single customer identifier that can take the in-store (POS) and online purchases and put them in one profile. Miss this, and an omnichannel customer turns out to be two separate, half-complete records; RFM done on only the online half will show lower frequency and spending than actually are.
Besides the identity, a few other factors matter: time zone-adjusted timestamps across POS systems of multi-region chains, currency brought to one reference currency for multi-country chains, and monetary values excluding returns; otherwise, customers with high returns are always getting rated highly. Generally, the scoring window is 12-24 months, longer for low-frequency categories like electronics, and at least a full year for seasonal retailers.
Let the Loyalty Program Do the Heavy Lifting
Loyalty data tends to be the strongest input in the whole dataset, simply because it's tied to a known identity rather than an anonymous basket. In practice, the bonus card ID scanned at checkout is often the most reliable cross-channel identifier a retailer has — more reliable than device IDs, emails, or anything reconstructed after the fact.
For retail groups running multiple brands under one loyalty program, this is also where a decision has to be made explicitly rather than left to default behavior: is customer identity unified across banners, or scored separately per banner? Leave it undecided, and frequency and monetary value quietly skew for anyone who shops more than one of the group's brands.
Clean Up Before You Score, Not After
The final task is the least exciting one: clean up customer records, remove test transactions and staff purchases, and most importantly, set a policy for missing or partial monetary values instead of simply assigning zero by default.
Transactions that remain unmatched may also be subject to special rules, for instance, no loyalty card used at the physical store, no account created during online checkout. Such transactions have to be obviously excluded from the per-customer scoring, not silently discarded and certainly not counted twice against the wrong customer profile.
If you can fix these three things, then your raw data will be reliable enough to be scored. What comes next is the important decisions, not the data cleaning, but how to convert it into scores: ranking customers by percentile or by fixed thresholds, deciding the importance of Recency relative to Frequency and Monetary value, and determining the meaning of a composite score when one is dealing with hundreds of thousands of them simultaneously.
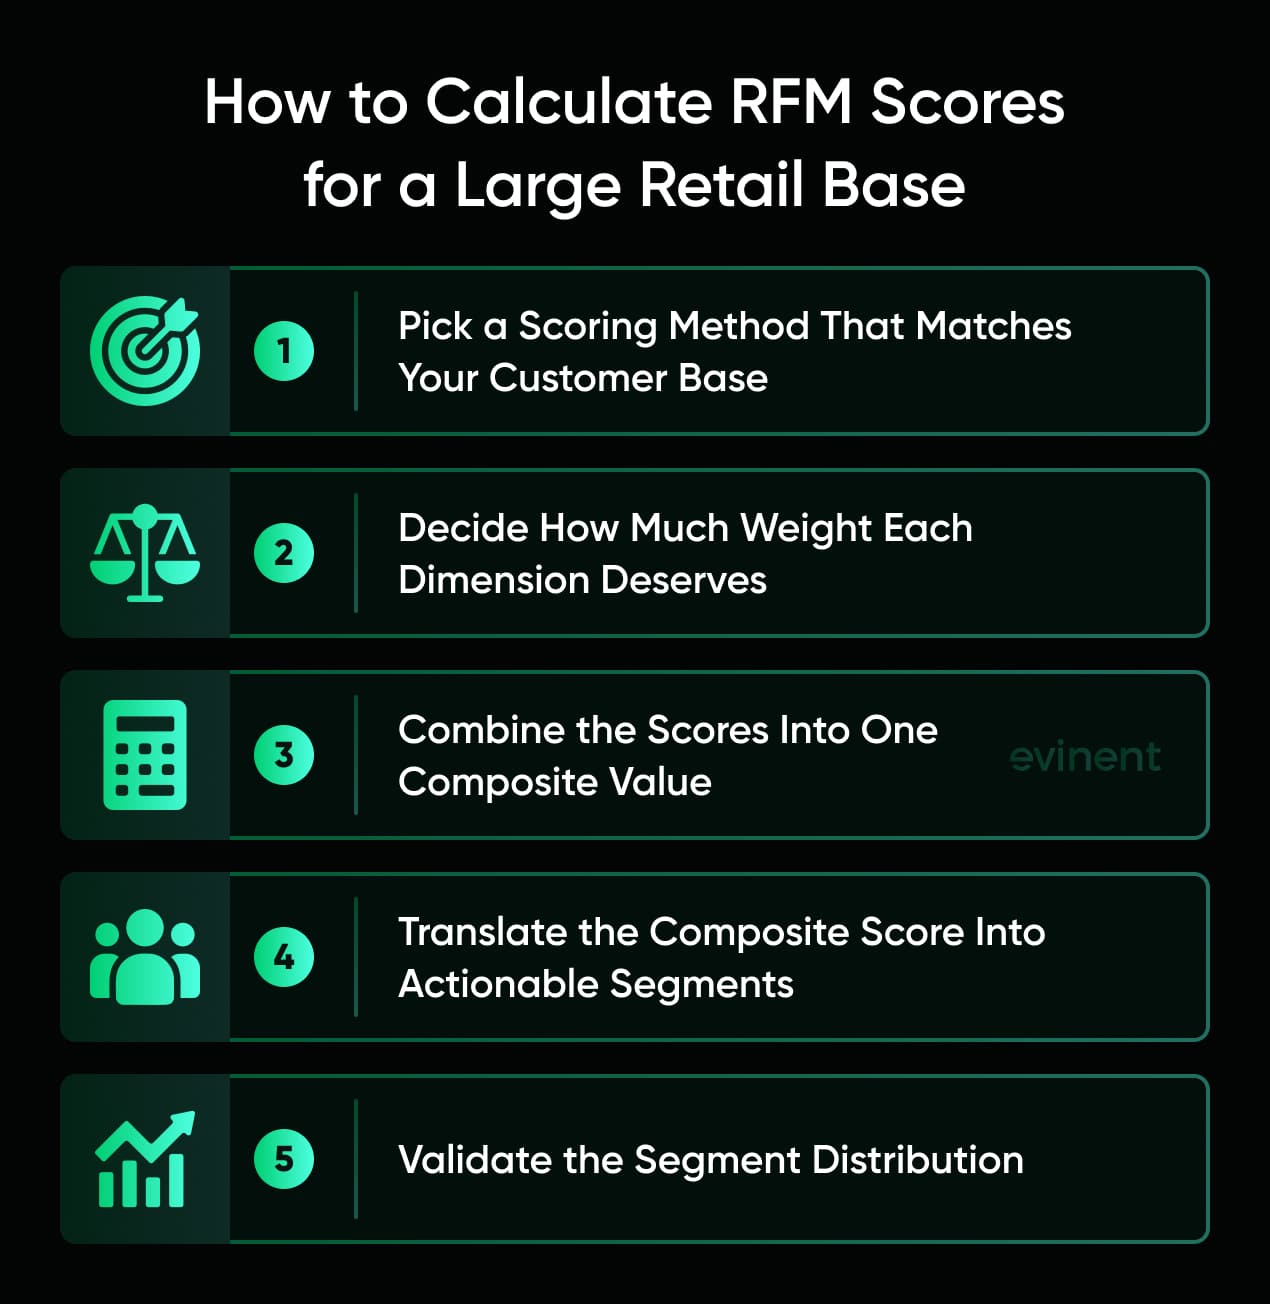
How to Calculate RFM Scores for a Large Retail Base
Step 1. Choose a Scoring Method That Fits Your Customer Base
The first decision is how each RFM dimension will be scored. Most enterprise retailers choose between percentile-based scoring and fixed thresholds.
Percentile scoring ranks customers relative to one another, typically dividing the customer base into equal-sized groups. This approach automatically adapts as purchasing behavior changes over time and generally produces balanced score distributions even across hundreds of thousands of loyalty members. For retailers with rapidly changing demand or seasonal fluctuations, percentile-based scoring often provides greater stability.
Fixed thresholds have specific business rules that are predefined, for instance, giving the maximum Recency score to those customers who have purchased within the last 30 days. Although this approach is more straightforward for business teams to grasp and create reports on, thresholds must be frequently checked as customer behavior changes over time. In fact, what is considered a "recent" purchase for a grocery store is quite different from that of an electronics retailer.
Step 2. Decide How Much Each RFM Dimension Should Matter
Although recency, frequency, and monetary value form the foundation of every retail customer segmentation RFM model, they do not always contribute equally to customer value.
Most retailers focus more on Recency as they consider that a recent purchase usually has the highest correlation with future purchases. For instance, a customer who made a purchase last week is more likely to be receptive to marketing as compared to one who made heavy purchases a year ago but has now become inactive. Brands with high purchase frequency, like grocery, pharmacy, or beauty, tend to score greatly on the Recency factor, whereas premium or less-frequent-purchase categories may assign more importance to Frequency or Monetary value.
The weighting strategy should reflect customer buying behavior rather than applying identical importance to all three dimensions by default.
Step 3. Calculate a Composite RFM Score
After scoring each dimension, the final step is to combine these separate values to obtain an overall RFM score that reflects the customer effectivity within the loyal customer cohort. This consolidated score facilitates the customer assessment process since it brings together three different behavior measures into one single ranking system that marketing, CRM, and analytics teams can always understand in the same way. The aim is not to create a mathematically complicated formula but to develop a number that best represents general customer quality of the whole retail population.
Step 4. Map Composite Scores to Actionable Segments
A composite score has little practical value until it is translated into business segments. Most retail implementations map score ranges into actionable groups such as champions, loyal customers, potential loyalists, at risk, and lost. These segments allow marketers to move beyond individual scores and design campaigns around distinct customer behaviors and business objectives. Consistent mapping is essential so that every team interprets customer movement using the same RFM segmentation retail framework.
Step 5. Validate the Final Segment Distribution
The final step is to review how customers are distributed across segments before putting the model into production. An unusually large concentration of customers in a single segment may indicate that the scoring methodology, thresholds, or observation window should be adjusted rather than reflecting actual customer behavior. In one published retail RFM study, lost customers represented 22.63% of the customer base, followed by premium (19.15%), loyal (17.73%), and promising (15.81%), illustrating a distribution that remained both analytically meaningful and operationally manageable. (Research Gate, 2025)
There is no one-size-fits-all "correct" RFM scoring model for all retailers. The most effective method is that which mirrors genuine buying behavior, yields segment sizes that can be acted upon, and enables sustained marketing decisions as the customer base expands.

The 11 Segments and What Each One Means for Retail
A composite RFM score only becomes useful once it's translated into a name someone can act on. That's what the 11 canonical segments do — they turn a three-digit code into a plain-language answer to "what do I do with this customer?"
One warning to mention right away: there isn't one universal industry table that assigns each segment an exact, non-overlapping numeric range; thresholds differ depending on the platform and on how a retailer weighted and bucketed its own base in the scoring step. What remains the same in different implementations is the pattern each segment indicates on Recency, Frequency, and Monetary value. The table below is a handy reference; the example codes are for demonstration and not a fixed standard to be blindly copied.
Segment | R/F/M Pattern | Example Code | Retail Action |
Champions | High/High/High | 555 | Never discount — early access, real VIP recognition |
Loyal Customers | Mid-High/High/High | 543 | Category expansion campaigns, not more of the same |
Potential Loyalists | High/Mid/Mid-Low | 531 | Post-purchase follow-up timed to the category |
New Customers | Highest/Lowest/Low | 511 | 30-90 day onboarding + loyalty program intro |
Promising | Mid/Low/Low | 412 | Value-led content, not discount-led |
Need Attention | Mid/Mid/Mid | 333 | Low priority, batch-level campaigns |
About to Sleep | Declining/Mid (historic)/Mid | 321 | Early "we've missed you" + tailored recommendation |
At Risk | Low/High (historic)/High | 244 | Sub-segment by historical value before spending win-back budget |
Can't Lose Them | Lowest/Highest/Highest | 155 | Most aggressive, personalized win-back |
Hibernating | Low/Low/Low-Mid | 221 | Suppress from regular comms; reactivate only the highest-M subset |
Lost | Lowest/Lowest/Lowest | 111 | Exclude from active marketing entirely |
In the remainder of this section, we will discuss each segment in greater detail, as the rationale behind each action from a retail perspective is no less important than the designation itself.
Champions
Typically just a tiny portion of a retail customer base, still they control a huge chunk of the revenue in comparison to their number. This is because they are the ones who always pay the full price already, so giving them a discount will not get them to spend more; quite the opposite, it will only teach them to keep waiting for a coupon before making any purchases at all. The only different incentives that really tap into their desires are offering them first access to new products and rewarding them with real recognition (not points, but getting publicly recognized).
Loyal Customers
Possess a powerful, reliable purchase record but are not hitting the Champion-level spend. In the case of electronics stores, this group generally covers customers changing their gadgets following a fixed schedule. Expanding the category by presenting the neighboring product lines increases their basket without any extra acquisition cost.
Potential Loyalists
Recent buyers who haven't made frequent purchases yet. Usually, it is this group who a second purchase, converting them from a one-time buyer to a long-term customer. The follow-up after purchase that is scheduled according to the category, when is the next logical purchase?, is most effective here, far surpassing a generic "come back" nudge.
New Customers
Have just made their first purchase. The 30-90 days that follow determine whether the relationship forms at all. The right move is onboarding communication that introduces the loyalty program and personalizes product discovery based on what they just bought, not a blanket welcome email.
Promising
Frequently seasonal buyers or one-time promo shoppers. The risk with this segment: they respond to discounts, not to full-price communication, so discount-led engagement reinforces exactly the habit you don't want. Content that delivers value beyond price works better at this stage.
Need Attention
Often the number one group in terms of headcount in a big retail base, precisely because "moderate everywhere" is the easiest category to fall into. It is not the top priority; Champions and Can't Lose Them come first, but batch-level campaigns work here.
About to Sleep
Still has a real window for intervention. A well-timed "we've missed you" message with a recommendation based on past purchase history outperforms a generic discount at this stage, before the gap between purchases widens further.
At Risk
Previously frequent buyers who've gone quiet, with the win-back window still open but narrowing. Time-dependency analysis helps calibrate the trigger: if someone typically buys in a category every 60 days and it's been 75, that's the moment to act, not an arbitrary calendar date.
Can't Lose Them
Former Champions who've ceased buying but have demonstrated the real value before stopping. This group validates the rationale behind the most forceful win-back spending among the entire base: personalized contact coupled with a generous offer, as it is very costly to lose them for good in a way that losing a Promising customer isn't.
Hibernating
Make up a real, unglamorous share of most loyalty bases — this isn't specific to any one retailer's program design. Deloitte's research found that the average consumer enrolls in eight loyalty programs but actively participates in only five, and that gap is even wider at the individual-program level. Suppressing them from regular campaigns is usually the right call, since the cost of activation exceeds the expected return for most of this segment — but periodic, narrow reactivation aimed only at the highest-M subset can still be worth running.
Lost
The right approach is to take them off active marketing lists if they show no significant activity on any of the three factors, instead of continuing to send volume on reactivation campaigns that always underperform here.
Assigning the names to the segments is the simple part of the process. The thing that differentiates a really helpful RFM implementation from one that is just a pretty face is the next step: accurately adjusting the frequency of interaction with each segment in a way that anticipates their movement, whether it be a new opportunity or a risk, before they become a fait accompli.
Refresh Rate: The Decision Most Retail Teams Get Wrong
Many RFM implementations just take over their refresh schedule without anyone noticing the batch job that defaults to it, usually weekly, sometimes monthly. RFM refresh rate retail is not a technical setting. It's a business decision that can really impact revenue if done incorrectly. That's why this section tries to help close that gap.
What "Weekly" Actually Means at Scale
Picture a chain with 300,000 active loyalty members. If 15% of them enter the At Risk window in any given week, that's 45,000 customers sliding into a worse state, tracked on a batch schedule instead of in real time. On a weekly refresh, some of those customers have already been At Risk for six days before the system notices anything changed. At that scale, "weekly" isn't a cadence. It's a six-day blind spot that repeats every single week, indefinitely.
Match Cadence to the Category, Not a Default
The right refresh rate isn't universal. It should track how often customers in that category naturally buy. A pharmacy chain selling consumables needs daily or near-real-time refresh, since a week-long lag in a weekly-purchase category usually means the customer has already gone elsewhere. An electronics chain, where major purchases happen every 18-24 months, can tolerate weekly refresh for most segments. But even there, real-time detection still matters for the behavioral signals that precede purchase intent, which is exactly the next problem.
The Behavioral Slide Problem
A transaction-based RFM system is blind between purchases by definition. A customer who hasn't logged in for ten days shows no signal at all, since there's no transaction to score against. But the absence of site activity, or its decline, is itself a leading indicator. Behavioral enrichment, tracking site visits as a recency signal alongside purchases, lets the system catch the slide before a purchase gap even opens, instead of waiting for a lapse that's already happened.
The Intervention Timing Test
Here's the practical question that separates a good refresh policy from a cosmetic one. A customer drops from Loyal to At Risk on a Tuesday, and the win-back campaign fires on Friday. Has that customer already returned on their own, making the campaign wasted? Slid further into Hibernating, making it too late? Or already converted with a competitor, making it irreversible? The right answer depends on the category's competitive intensity and how quickly that specific customer typically responds, which is exactly why refresh rate can't be set once and forgotten.
Timing what happens next matters just as much as catching the signal. A customer drops from Loyal to At Risk on a Tuesday, and the win-back campaign fires on Friday. Has that customer already returned on their own, making the campaign wasted? Slid further into Hibernating, making it too late? Or already converted with a competitor, making it irreversible? The right answer depends on the category's competitive intensity and how quickly that specific customer typically responds — a judgment call that gets easier once segment timing and refresh cadence are treated as a system rather than a one-off setting.
Behavioral Enrichment: Going Beyond Purchase History
Transaction data on its own will always be about looking into the past. With behavioral RFM retail, you get a second layer totally different from transaction data by using the data of customer actions such as site visits, browsing, and cart activity to figure out who that customer is right now, a full step ahead of a purchase.
Recency Gets Redefined
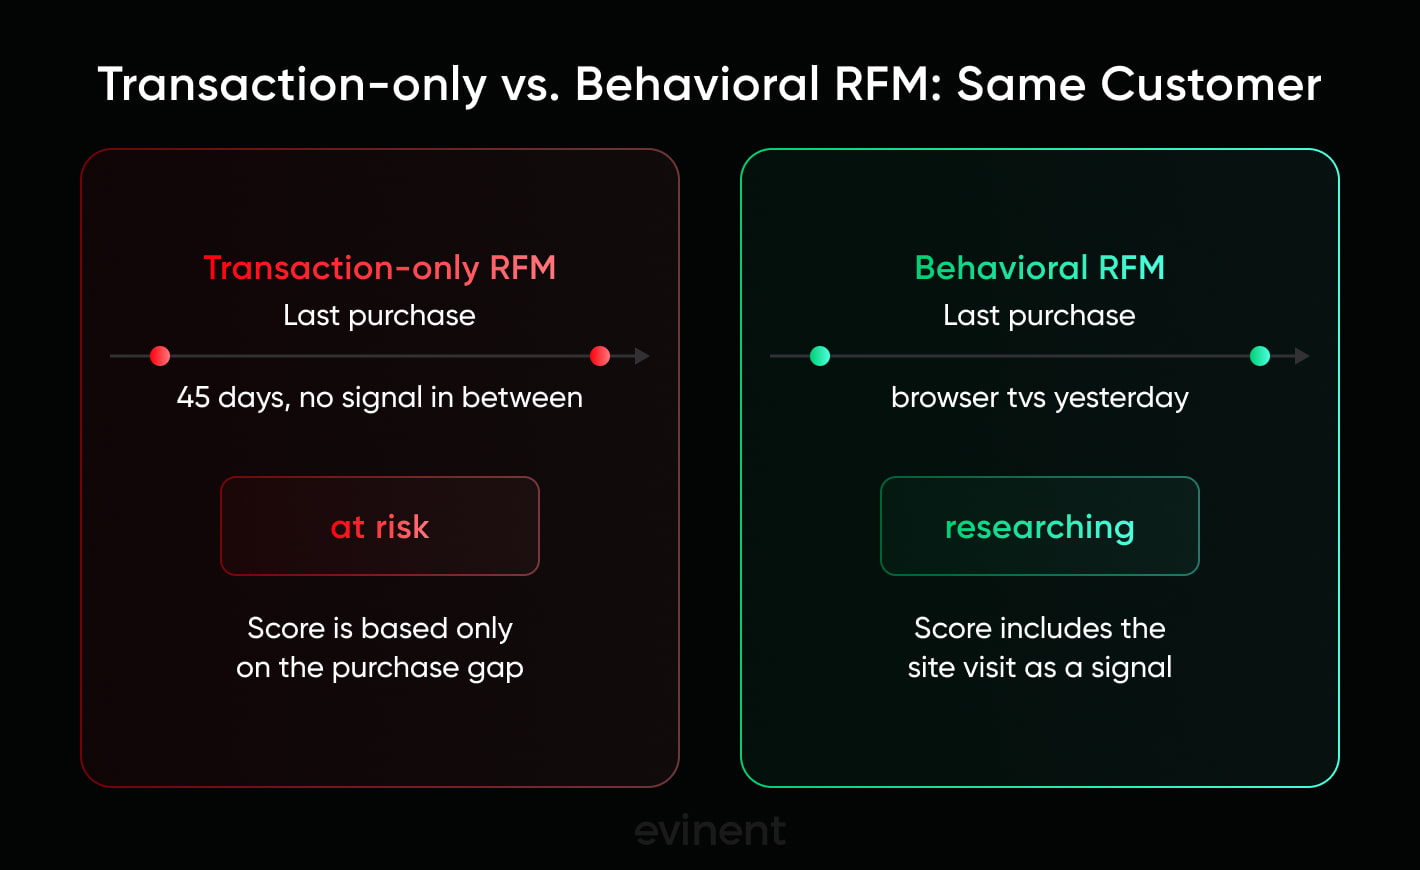
Behavioral enrichment not only uses days since last purchase to determine recency but also counts days since last meaningful interaction, whichever is most recent. For example, a loyalty member who checked out the TV category yesterday is certainly not at risk. They are just studying. A customer who only does transactions is scored as At Risk if there is a 45-day purchase gap; however, from the behavioral standpoint, the situation is reversed.
Frequency Gets a Second Signal
Purchase frequency misses a category of customer that matters: people who visit often, compare products, and read reviews, but buy less frequently than they browse. A pure transaction-based system undervalues them entirely, since their engagement never shows up as a purchase count. Adding visit frequency alongside purchase frequency gives a fuller picture of who's actually engaged with the brand, not just who's actively converting.
Monetary Value Has to Include the Whole Wallet
Retailers handing out loyalty cards and scanning them at the point of sale should consider that monetary value comprises not only online orders but also in-store purchases that are linked to the loyalty card. If the in-store purchase component is dropped from the calculation, the actual monetary value of an omnichannel customer will be grossly underestimated because the score will only portray half of the customer's real spending.
None of this works, though, if the behavioral data itself is incomplete. A large share of site visits from loyalty members happen without logging in, and if behavioral tracking only captures logged-in sessions, most of that browsing activity is invisible to the system. Assigning a unique identifier to anonymous visitors and matching it to the loyalty profile at login recovers that lost signal retroactively, which is what makes recency, frequency, and monetary enrichment actually work at scale rather than just in theory.
Segment-by-Segment Action Framework for Retail
You only reap the benefits of customer segmentation if the segments lead to different actions. The three segments that have the greatest potential for leverage are the ones that really deserve thorough coverage. The other ones can be treated with just a single line each, as their playbooks are quite straightforward.
Champions: Protect Margin, Don't Chase It
Champions already buy at full price, which means the worst thing a retailer can do is treat them like anyone else on the discount list. Sending a Champion a coupon doesn't earn extra spend. It teaches them to wait for the next one before buying at all, turning a full-price customer into a discount-dependent one.
The levers that actually work here are early access to new arrivals, invitations to product feedback programs, and recognition that feels earned rather than automated. In electronics retail specifically, Champions are often the first buyers of a new product line, which makes their early purchase behavior a useful signal of how that line will perform more broadly.
At Risk and Can't Lose Them: The Highest-Leverage Win-Back Window
These two segments share a defining trait: proven purchase history that's gone quiet. That combination makes them worth more marketing effort per customer than almost any other segment, but only if the intervention is built right. It needs to be personalized, referencing the customer's actual purchase history rather than a generic "we miss you" line.
It needs to be timely, triggered by the behavioral slide itself rather than a fixed calendar date. And it works best multi-channel, since email suits a considered purchase while SMS or push notifications suit something more time-sensitive. The timing test matters as much as the message: the right moment to send is when behavioral signals show the customer has come back to browse but hasn't purchased yet, not after the segment has already deteriorated further.
New Customers: The 30-90 Day Window
The time right after purchasing a first product is when a loyalty relationship is established or not, and the majority of that decision is made within the first 30 to 90 days. The most effective New Customer program accomplishes three things during that period: it firstly presents the loyalty program itself, secondly sends one personalized recommendation based on the customer's recent purchase instead of a generic catalogue, and thirdly it uses the typical purchasing cycle for that category to predict when the second purchase is likely to occur. The main aim of this part is to get the second purchase, as this is the transition from a one-time buyer to a repeat one.
The Rest of the Segments, in Brief:
The rest of the segments require less intense marketing efforts as their strategies are simpler:
Loyal Customers, product diversification, introduction of similar product lines they have not yet experienced
Potential Loyalists, a follow-up purchase invitation synchronized with their product category
Promising, use of value-driven messages rather than more discounts, because they are usually the ones who are motivated by price when converting in the first place
Need Attention, lowest priority; generic email campaigns are more than enough
Hibernating, completely removed from regular emails and only rare, very targeted reactivation attempts
Lost, no longer targeted for active marketing efforts
None of this works as a one-off campaign, though. It only works as a system where segment membership feeds directly into retail marketing automation, so a customer moving from Loyal to At Risk triggers the right message automatically, rather than waiting for someone to notice.
RFM and Loyalty Program Data: The Natural Integration
While loyalty programs gather data, RFM analysis uses that data to figure out which customers are the most valuable. So these two approaches complement each other in a way that is quite rare.
Why Loyalty Data Is Already RFM's Best Input
Every loyalty transaction contains a member ID, a timestamp, and a purchase value the moment a customer scans their card or logs in. Nothing needs to be built to generate this. It's a byproduct of the loyalty program simply running.
That's what makes the bonus card ID, scanned at POS, the most reliable cross-channel identifier most retailers have. It's tied to something the customer actively presents at checkout, in-store and online alike, unlike a device fingerprint or an email match that has to be inferred after the fact.
Where the Integration Usually Breaks
Usually, in reality, such a rich data source remains isolated. The loyalty platform monitors tier and points balance, while the marketing team tracks the open rates and click-throughs. Neither of the two systems informs the other in real time.
Consequently, no one can see at the moment who fits where on Recency, Frequency, or Monetary value perfectly. The data necessary for RFM are there. They are just stored in a system that isn't designed to score them.
What Good Integration Looks Like Instead
This is not really a data problem, but more of a plumbing problem. Loyalty transactions should be coming to the RFM scoring engine in real-time, not after a ed batch export once a week.
Once that pipe exists, everything downstream gets sharper on its own. Segment-transition messages stop being generic and start referencing the customer's actual points balance or an upcoming tier expiry. Consent captured once at loyalty enrollment flows automatically into suppression rules everywhere, instead of being re-managed by every channel separately.
None of this is optional if customer lifetime value is meant to be more than a rough estimate. CLV runs on the same unified purchase history that a properly wired RFM system already needs.
Common RFM Mistakes in Enterprise Retail
Building RFM on Online-Only Data
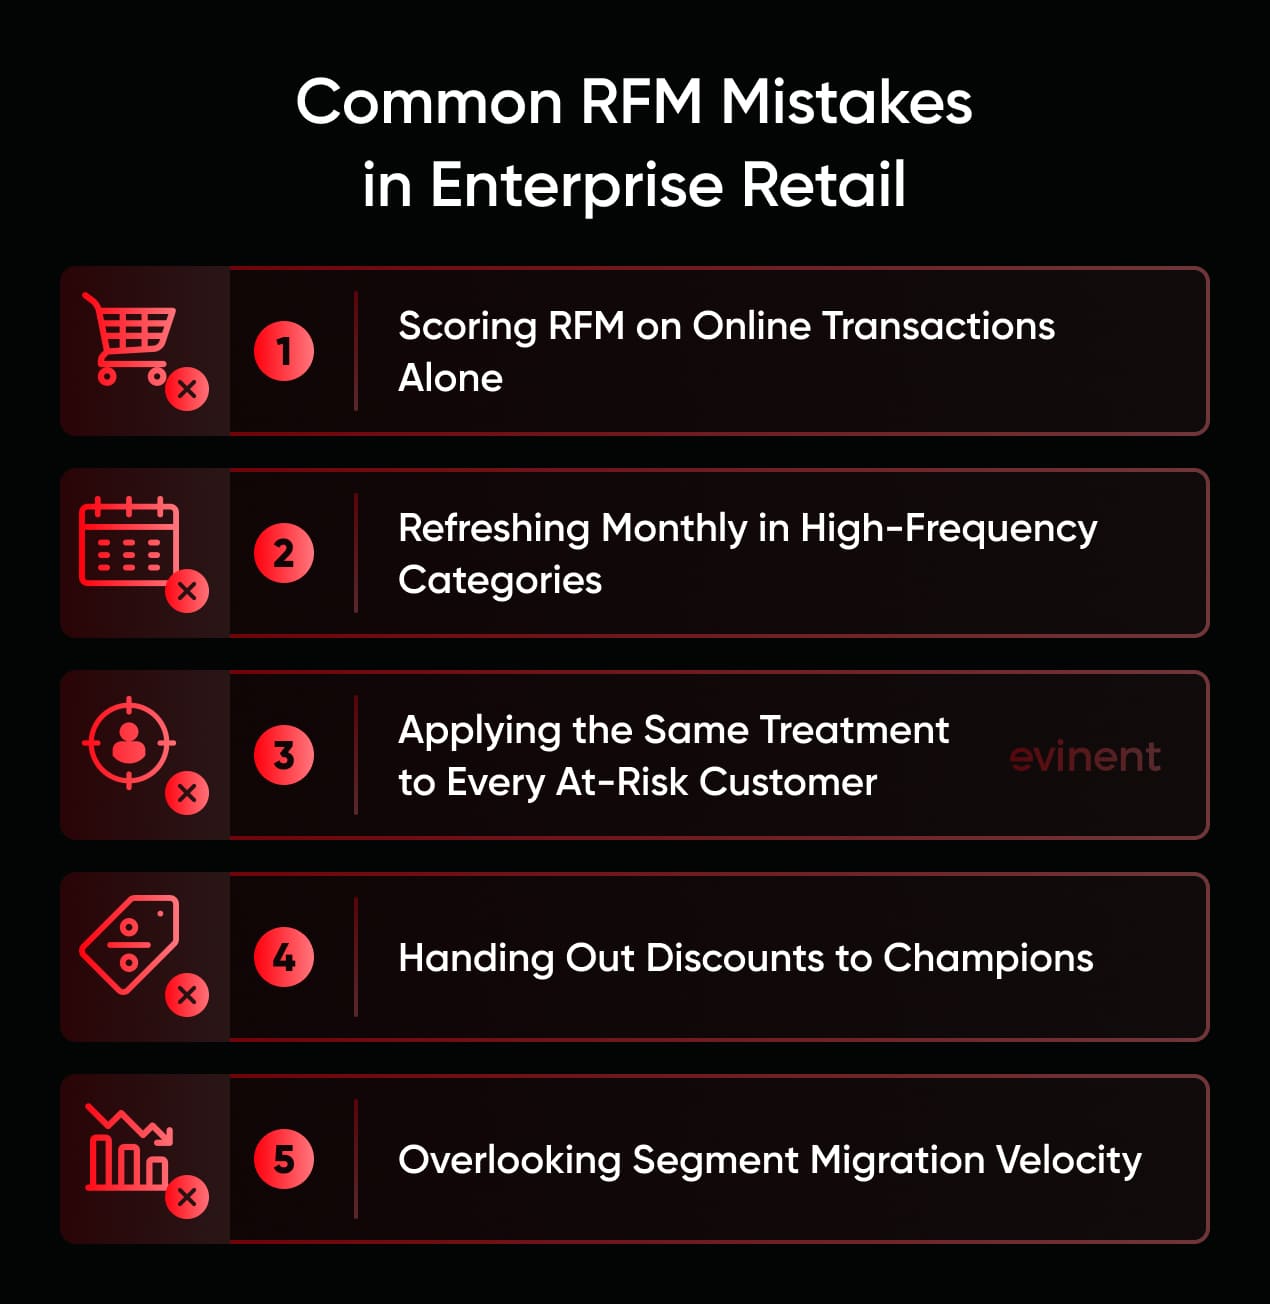
A loyalty member who comes to the store and makes a purchase twice a month will be seen as a very low-frequency customer if only online transactions are being scored. Frequency and monetary measures are not really incorrect here. They are simply incomplete, representing only half of the customer's whole activity. For omnichannel retailers, integrating point of sale (POS) data is not a luxury. Without it, RFM basically is evaluating only a portion of the relationship and mistaking it for the entire picture.
Monthly Refresh for High-Frequency Categories
With pharmacy, grocery, or accessories retail, a monthly refresh cycle is inherently too slow. In fact, a customer who gives up on a product which they buy every week can turn into a rival's customer long before the next monthly batch even realizes that they have left. The error one makes when deciding upon a monthly refresh is that one does so without first determining whether the purchase frequency of the category is able to withstand such a long .
Treating All At Risk Customers Equally
A Champions-grade customer who slides into At Risk is worth a meaningfully bigger win-back investment than a New Customer who does the same. Scoring both the same way, and therefore treating both the same way operationally, wastes budget on the wrong half of the segment. Sub-segmenting At Risk by historical monetary value fixes this, and it changes budget allocation more than most teams expect once they actually run the numbers.
Discounting Champions
The biggest mistake by far is to provide coupons to the highest-value segment in the base, i.e., the champions. They are not motivated by discounts because they already buy at full price and love the brand. If you give them coupons, you're actually training them to only purchase when a discount is available. This is contrary to what this segment should be protected for. In fact, recognition and early access are far more effective than discounts in this segment, and this is not limited to only a few retail categories.
Ignoring Segment Migration Velocity
The segments themselves only tell half the story. How fast customers move between them is the other half, and it's often the more useful signal. A retail chain where a quarter of Champions slide into Loyal in a single quarter has a very different retention problem than one where only a small fraction do, even if both chains show the same segment sizes on any given day. Tracking migration velocity surfaces that kind of systemic issue well before it shows up as a revenue drop.
These errors do not manifest in the segments themselves. Instead, they are detected in the way segments are constructed, updated, and utilized. And that is precisely what allows them to remain unnoticed in large organizations for a very long time even after they cause some damage.
How Evinent Analytics Powers RFM for Retail
Everything in this guide describes a good functioning of an RFM system. Evinent Analytics follows precisely the same blueprint, but is structured into five cooperating layers rather than being in the form of a single scoring
The Five Layers
The data layer gathers customer profiles from CRM, ERP, POS, and e-commerce systems and integrates them into a single customer record, linked by loyalty card ID and containing a transaction history of up to 10 years, with returns automatically deducted from the monetary value.
The scoring layer operates in real or near-real-time, supplying behavioral signals, site visits, category browses, cart activity, and recency scoring together with transactions, with anonymous visitor sessions matched to loyalty profiles at login to recover behavior that would otherwise be lost.
The segmentation layer automatically generates the 11 standard segments, and changes detected at the event itself rather than waiting for the subsequent scheduled refresh; a Champion revealing early signs of decline is warned before the purchase gap.
The activation layer links segment changes directly to triggered communications via SMS, email, Viber, WhatsApp, and push, so that a customer transitioning from Loyal to At Risk will automatically receive the right message.
The analytics layer measures segment composition, migration speed, and campaign effectiveness over time, with export to Excel or Power BI for teams that require it in their own tools.
Proof It Holds Up at Scale: How Evinent Developed a Scalable E-commerce Platform to Drive Business Growth
All these five layers are obliterated by a system that can't handle real transaction volume or real-time data flow. A project run by Evinent for a large Eastern European e-commerce retailer that rebuilt the platform that had been unable to support the retailer's growth is a pretty good example here: the same kind of infrastructure issue that determines whether an RFM system scores customers on clean, current data or on something partial and ed.
The challenge: the existing system struggled during traffic surges, order processing was slow, and the mobile experience for both shoppers and store managers was underperforming.
The approach: Evinent rebuilt the platform around auto-scaling cloud infrastructure on AWS, redesigned the order management system for faster processing, built dedicated mobile apps for customers and store managers, layered in AI-powered search and recommendations, and migrated with zero downtime.
The results:
320% increase in online sales over roughly two and a half months during a lockdown-driven demand spike
23% improvement in conversion rate from improved search and recommendations
E-commerce grew to 60-70% of total company revenue
Why Retailers Choose to Build This With Evinent
15+ years building marketplace and e-commerce platforms.
Experience spanning mid-sized businesses and enterprise clients across retail, logistics, and e-commerce.
85% of our clients return to us for subsequent projects, as our work is geared towards real-world operating conditions rather than merely technical specifications.
FAQ
What is RFM analysis in retail?
Implementing RFM analysis entails scoring each loyal customer on the three aspects of Recency, Frequency, and Monetary value, and then assigning the merged score to one of the 11 customer segments ranging from Champions to Lost. This is particularly effective in retail, as buying and behavioral patterns are directly observable in transaction data; thus, there is no need to consider a separate 'usage' layer in the analysis.
How do you calculate RFM scores for a retail loyalty program?
Score customers using either percentile or fixed-threshold scoring, weight Recency more heavily than Frequency and Monetary if future behavior matters most, then map the composite score to a segment. At enterprise scale, this needs unified POS and online transaction data and, often, category-level scoring rather than one score across the whole base.
How often should RFM segments be updated in retail?
It depends on the category's natural purchase cycle, not a fixed default. High-frequency categories like pharmacy or grocery need daily or near-real-time refresh; low-frequency categories like electronics can tolerate weekly refresh for most segments, but still benefit from real-time behavioral signals to catch churn before a purchase gap opens.
What are the 11 RFM segments?
Champions, Loyal Customers, Potential Loyalists, New Customers, Promising, Need Attention, About to Sleep, At Risk, Can't Lose Them, Hibernating, and Lost. Each represents a different pattern across Recency, Frequency, and Monetary value, and each calls for a different retail action rather than one generic campaign.
How does RFM analysis work with a loyalty program?
Loyalty programs are a very good source of RFM data, since transactions with loyalty cards include member ID, purchase time, and purchase value that the RFM model requires. The bonus card ID scanned at point of sale is often a retailer's most reliable cross-channel identifier for linking in-store and online purchases.
What is the difference between RFM and behavioral segmentation?
RFM divides customers based solely on their transaction history, what they bought, how often, and how much. Behavioral segmentation goes beyond the transaction itself and includes other signs such as website visits and browsing behavior, which can detect a customer drifting toward churn even before it appears as a purchase gap.
How do you use RFM to reduce customer churn in retail?
Focus win-back effort on At Risk and Can't Lose Them, timed to the behavioral slide rather than a calendar date, and sub-segment by historical value so budget goes to the customers worth recovering. Catching the decline through behavioral enrichment, before the purchase gap even opens, works better than reacting after the fact.
Key Takeaways
RFM takes the customer transaction history and turns it into a set of sorted, actionable scores and an executable map, in fact, rather than just a formula.
A solid data foundation is crucial here: unified POS and online identities, neat monetary figures, and a rule for non-matching transactions.
In scoring, you are really making a judgment call: percentile vs. hardcoded thresholds, how the weighting of Recency plays out, category-level vs. base-level features.
The 11 segments are nothing but typical patterns found in data; exact cutoff levels can be somewhat different, but still, each segment has the same set of retail actions.
How often you update the RFM is a question for the business; it should correspond to the actual turnover rate of the category.
Behavioral signals can detect the decline even before purchasing is affected; using transaction data alone is too ed.
Predict your RFM segments retail: you can derive them from loyalty programs.
The most expensive pitfalls in RFM are the ones that you don't usually expect a formula to fail; these are things like incomplete data, mismatched pace, not discounting customers who don't need discounts, etc.
At an enterprise level, RFM becomes more than a report; it becomes a backbone of the business that drives decisions and automates processes.
Share