
The Moment Your Analytics Stops Growing With You
Every enterprise retailer hits this moment eventually. The retail customer analytics platform that gave you a clear picture at 20 stores or $10M in annual revenue starts producing something narrower ーnot wrong, exactly, just incomplete ー once you cross into 100 stores or $100M. Nobody flips a switch and breaks the dashboard. It happens quietly, one workaround at a time, until the workarounds are the actual workflow.
The signs are normally visible within the room rather than in the numbers. A regional manager is using last week's customer segment report to plan today's campaign, yet "live" in your platform still means an overnight batch job. An analyst opens up the BI tool, realizes he won't be able to answer leadership's request of a cross-category question, and quietly decides to export raw data into Excel to hand-craft the real model, a process carried out so frequently, it is beginning to be looked at as a normal and acceptable work behavior.
A dashboard that used to load in two seconds now takes fifteen, because it was developed for a dataset smaller than a fraction of the current size and nobody wants to be the one who tells the platform needs to be replaced.
None of these things show up as an outage. It only reveals the decisions made using data that's three days old, based on segments that churned late, marketing spend that no one can link to a particular sale. The true cost is here: not a failed tool, but a gradual weakening of the trust in what the numbers are really showing.
Enterprise retailers increasingly struggle with fragmented customer data as shopping journeys span digital and physical channels. According to McKinsey, around 80% of consumers make their retail brand or purchase decisions online, even if the final purchase happens in-store, highlighting the importance of unified cross-channel analytics.
And, fundamentally, this is a limitation of the platform rather than a configuration issue; there's nothing one can do to get a batch-based system that records sessions, a system that doesn't even manage identities, a platform that doesn't track across channels, to change the way it operates just by messing around with how it is set up.
It may be challenging to recognize, but often the limitation is not a grand failure that the retail analytics ceiling announces with a single stroke. It manifests through six different, familiar frustrations, the sort of things that most teams have quietly learned to work around rather than calling them a systemic problem. Once you begin to look for them, it will be easy to observe:
Why customer identity breaks down the moment someone switches channels, and what it costs you when your platform can't follow.
What it really means for a "real-time" segment actually to be a week old — and why that matters more than it looks.
The habits your own analytics team has already built around a platform that can't answer the questions you're actually asking.
The kinds of fraud that hide in plain sight until they've already eaten into your margins.
The gap between recommending to everyone and recommending to someone — and what it's worth.
What it takes to know a campaign actually drove a sale, not just that someone opened it.
Sign #1: Your Customer Profiles Don't Survive a Channel Switch
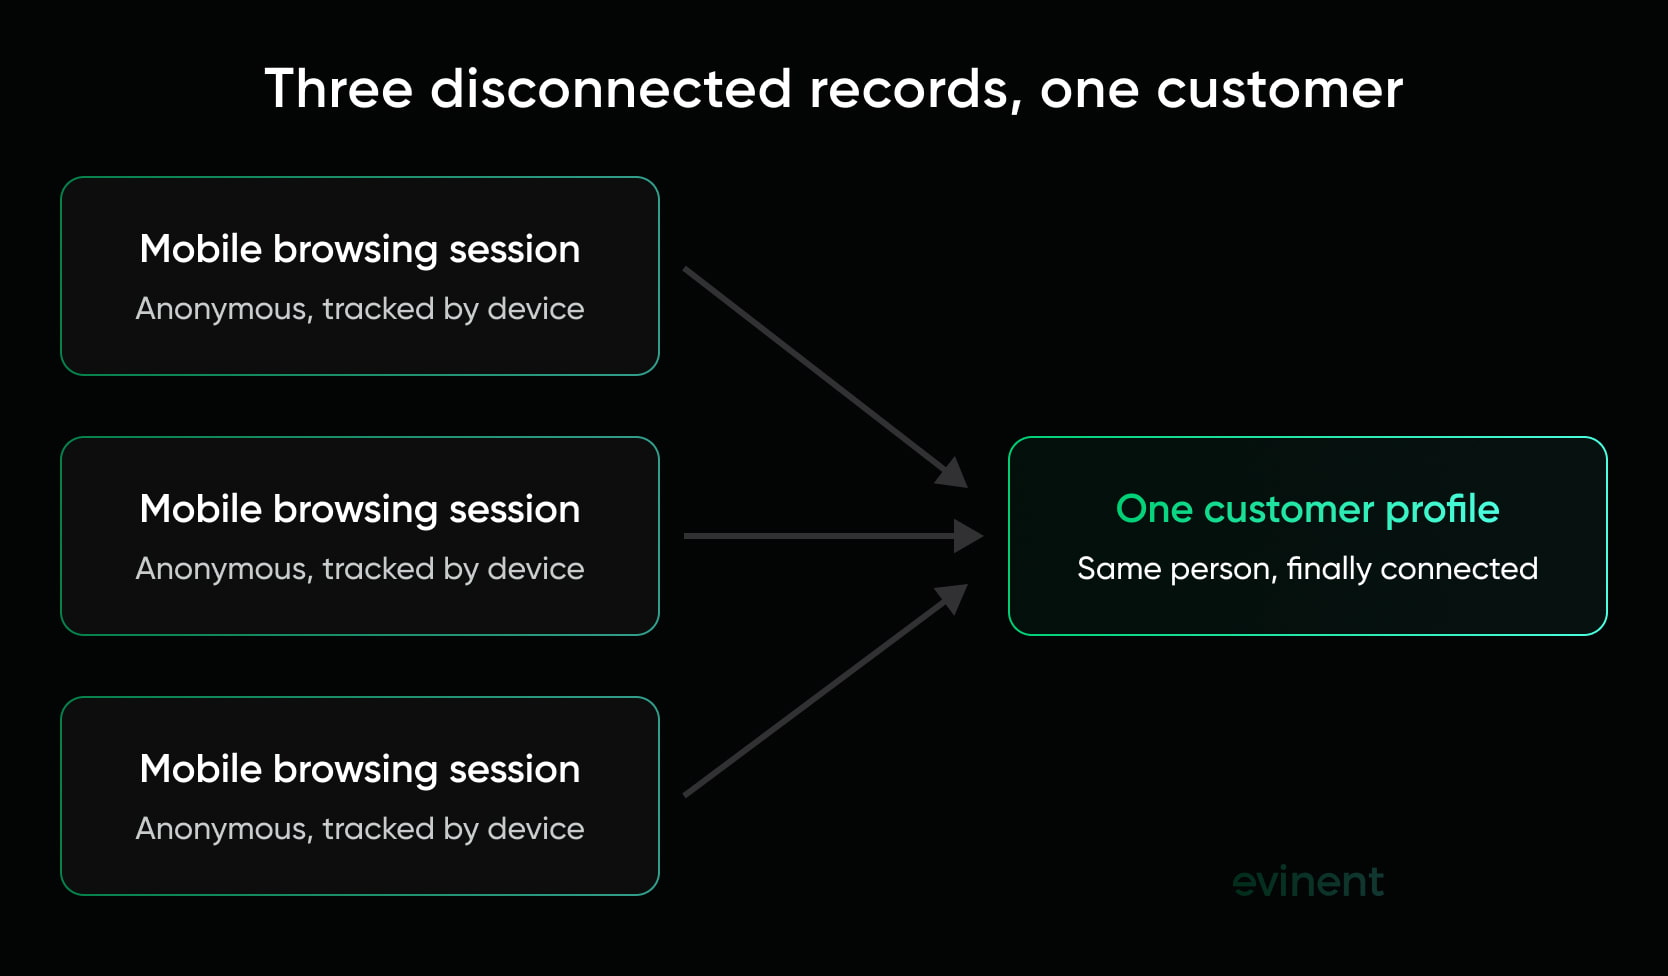
Imagine a customer at a mid-size electronics storefront with 120 store locations, a loyalty program, and a technical-speaking ecommerce customer analytics site that technically "talk to each other." A customer is scrolling through laptops on their smartphone while at the office, finds their pick, adds it to a virtual cart, then closes the app/tab in one fluid motion. Two days later, this customer walks into any store, asks the associate for the very model of the laptop they browsed online, and makes a purchase using their loyalty card.
Seven days later, they receive a newsletter email that welcomes them as a new subscriber and offers recommendations for accessories for the laptop, which the system believes is not connected to the customer.
To the platform, this was never one person. It was three:
An anonymous mobile browsing session
A loyalty card swipe in-store
An email address on a marketing list
Why Standard Analytics Tools Miss This
Tools such as GA4 are meant to track the device or browser, the cookie, not the person who switches between them. The discrepancy is hardly any for a single-channel retailer, as they only have one way of doing business. On the other hand, the difference is significant for an enterprise seller who has a loyalty program, a point of sale, and an online store as different platforms and systems. The former means getting full insights into your customer, while the latter refers to a customer whose interactions are merely visible in various tools but not in relation to each other.
Why This Can't Be Fixed With a Settings Change
The identification through various channels can be solved in the following ways:
To connect a user's anonymous online actions with a recognized identity as soon as they log in or swipe their card.
Combining a user's web surfing, buying, and reward programs into a single narrative, unbroken chronology.
Real-time execution of the aforementioned steps, not reconciled by hand afterwards
This custom integration layer that sits as the upper layer of your POS system, e-commerce platform, and CRM is different from the feature that can be turned on and off in an off-the-shelf tool — it's the kind of capability that comes from a purpose-built behavioral analytics retail platform, not a generic dashboard. It is very rare that these platforms have such a capability built-in. This is the very reason why the purpose-built retail analytics platform closes this gap by providing the customers with such a feature.
Evinent Analytics handles this by tracking anonymous site behavior and auto-matching it to the right profile the moment that visitor logs in — closing the gap between who they were online and who they are at checkout.
Sign #2: Your RFM Segments Are a Week Old When You Act on Them
Customers' segments in the majority of mid-level analytics systems are being reclassified via batch jobs which are running either every night or several times a week. It looks innocent at first sight, up until the moment you think about what's occurring after the updates but before the next one comes around.
The Cost Of A Late Win-Back Campaign
A customer has stopped buying. Their behavior changes from "regular" to "at-risk" in the blink of an eye as their purchase schedule fails to happen. But the platform won't change this information until the next batch processing runs. By the time the segment updates and the win-back campaign fires, three days have gone by. Let's see what happens:
The customer might have already found what they looked for in a competitor
Or they bought on their own again, so the "win-back" offer would have been unnecessary and rather offensive
Or the moment that would have caught their attention a discount, a personalized nudge has simply passed
In any case, the campaign arrives too late to change the situation it was created for. The segment was right. That's just it, right, but not fast enough to be relevant.
This timing gap matters because customer expectations have changed. According to Salesforce's State of Marketing, 73% of customers expect companies to understand their unique needs and expectations. When segmentation relies on batch processing instead of real-time behavioral data, retailers risk delivering personalized offers after the moment they could have influenced the purchase decision.
What Live RFM Actually Requires
Real-time segmentation means recalculating recency, frequency, and monetary value as behavior happens — not once a day, but continuously, as each purchase, browse, or drop-off event comes in. Architecturally, that means the segmentation engine sits on a live event stream rather than a scheduled query, so a customer can move from "active" to "at-risk" the moment their behavior actually changes, and a triggered campaign can fire within that same window instead of a day or a week later.
This is the one layer at which a majority of the SaaS analytical tools quietly decide not to go beyond: batch processing is easier to develop and perfectly suitable for reporting, but is not fast enough to trigger anything while it is still relevant.
Sign #3: Your Team Exports to Excel to Get Real Answers
If it's part of your analytics team's routine to schedule data exports to Excel or Power BI to perform analysis that their current platform "can't do", you're actually pointing out that there is a limitation; it's not them; it's the tool that is the problem.
Three Questions Worth Asking Your Team
When did you last export raw data to answer a question the dashboard couldn't?
How often does "let me pull this into Excel" come up in a normal week?
Is there a report your team builds by hand every month because there's no native way to generate it?
If the answers make you wince, the platform has already shown you where it stops you; your team just found a way around that rather than treating it as an issue.
What This Workaround Usually Hides
The analysis that ends up in Excel is rarely simple. It's things like cross-category correlation — noticing that customers who buy antibiotics also tend to buy blood pressure medication within a specific window, a pattern that only shows up when you can query across categories and time at once. Or custom cohort analysis that doesn't fit a pre-built report: a specific segment, a specific date range, a specific behavior sequence, none of which the platform's standard filters were built to handle.
Most retail SaaS tools either don't support this kind of analysis at all, or lock it behind an enterprise tier that costs more than the workaround it's meant to replace. So teams keep exporting, keep rebuilding the same queries by hand, and keep treating it as normal right up until someone asks why the "advanced analytics platform" can't do analysis a spreadsheet can.
Native correlation and time-dependent analysis are exactly the kind of features that close the above gap; the platform itself highlights the pattern, while, on the other hand, manual and time-consuming re-construction of the picture by a team is the case if such a feature is not available in the platform.
Sign #4: You Can't See Fraud Until It's Already Cost You Money
Traditional analytics tools give you the who/what/where/when of sales very well. When, for example, they identify an unexpected decline that turns out to be fraudulent transactions (e.g., misuse of loyalty cards or abuse of discount systems), they normally point it out only after the loss is reflected in the P&L statement, meaning too late for the seller to act.
Two Kinds Of Fraud Your Dashboard Isn't Built To Catch
In addition, a loyalty program agent may subtly reward a loyalty points account with a gift for a personal one, or even for a friend, one that small that no transactions appear odd; a leak can go undetected months at a time before accumulating into a sizeable figure. The standard sales report has no basis to raise it since the fact is not that a single sale appears abnormal.
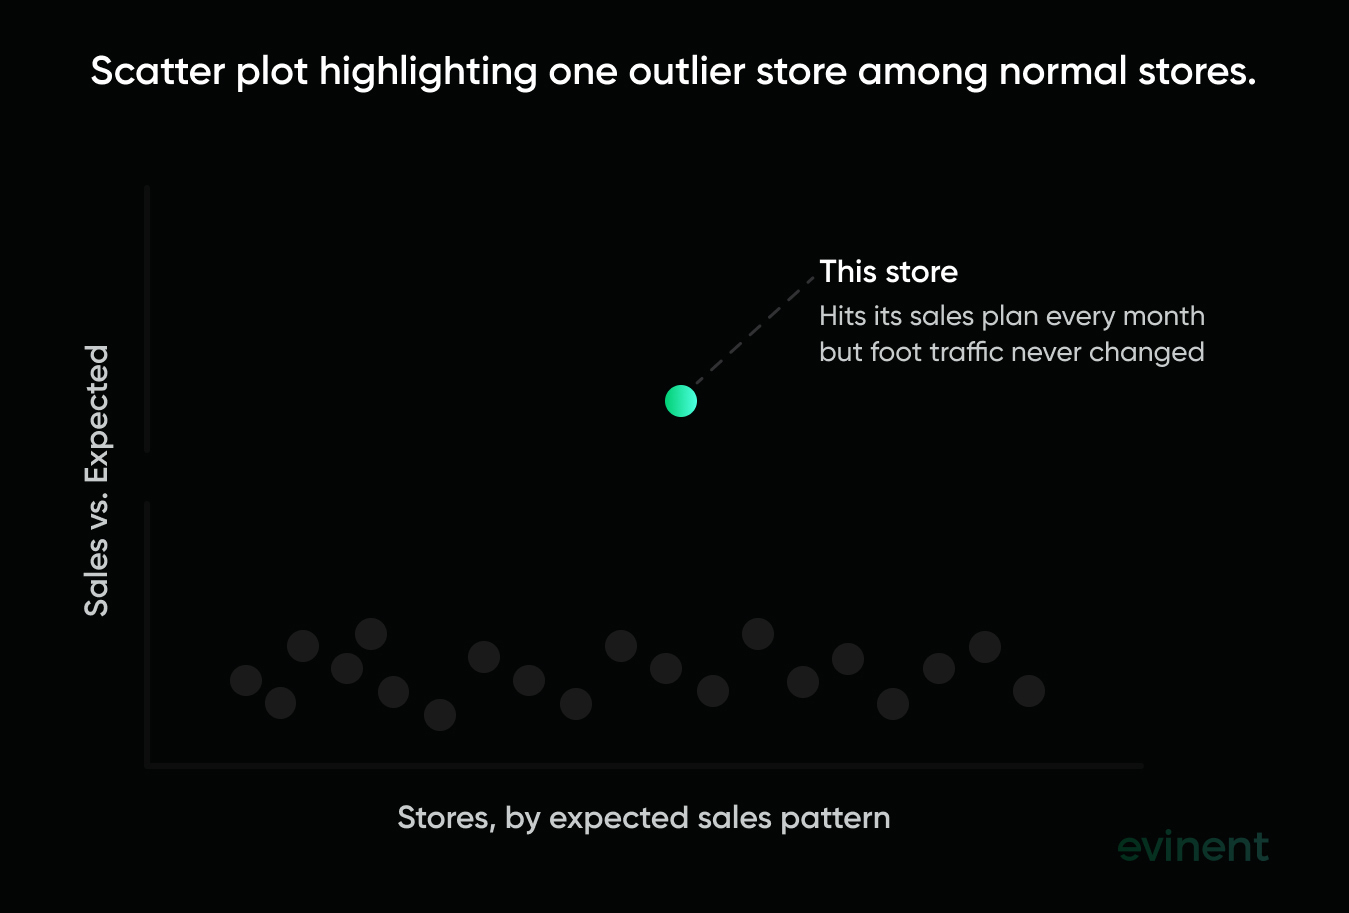
A store may keep on beating the sales plan in a manner that does not conform to its foot traffic, assortment, or seasonal patterns, such as anything from inventory stealing to fake refunds. Overall, the sales totals are good. It is really the difference, the deviation from the store's normal pattern, that exposes it.
Why This Requires Outlier Detection, Not Just Reporting
Identifying anomalies is simply spotting unexpected behaviors, looking away from the regular account activity, store behavior, and the usual patterns of transactions. It is quite different from just summarizing your income. This is a different job entirely than producing sales reports, and that is really the job that the standard retail analytics systems were never intended to take on.
This point alone is so valuable it could deserve a separate post; our team explores retail fraud detection in depth in an article devoted to that topic.
Sign #5: Your Recommendation Blocks Are Generic for Everyone
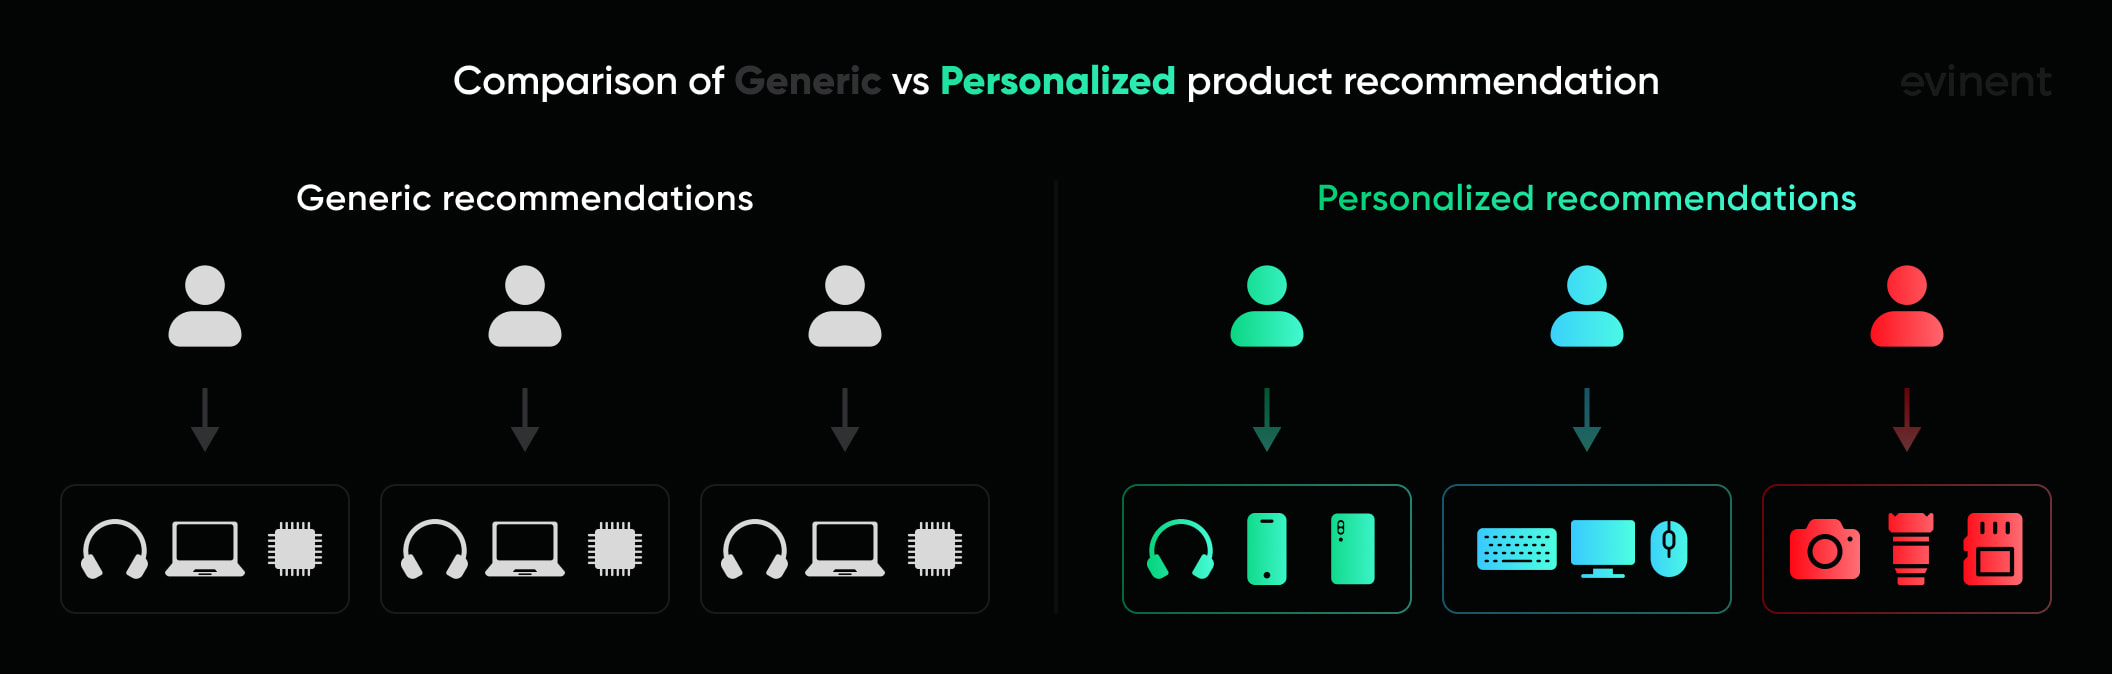
Cross-sellers feature "Customers also bought" as the standard logic in recommending items; basically, it is the combination of the most popular items bought together and, therefore, the same cross-item suggestions presented to all visitors regardless of their identities.
Generic Versus Individual: What The Difference Actually Looks Like
A generic "bestsellers" block shows the same handful of popular items to every visitor on a given category page — useful as a fallback, but blind to the fact that a returning customer with a browsing history and a purchase pattern is not the same as a first-time visitor. A personalized block, built on that individual's behavioral history plus real-time session signals — what they just viewed, what they've bought before, what they're doing right now — surfaces something closer to what that specific person is actually likely to buy next.
Sulpak, a major electronics retailer and an 8-year Evinent partner, integrated Evinent Analytics specifically to track how much of their sales came from these recommendation blocks — precisely because the difference between generic and individual recommendations isn't something you can estimate. It has to be measured, block by block.
What This Looks Like Technically
To make it work, a single recommendation logic won't do; different points in a customer's journey will require different data signals, whether it's recently viewed items, cross-category pairing, or behavior-based upselling. Evinent Analytics runs 9 different recommendation block types, each one matching a particular point in the shopping process, rather than deploying one "customers also bought" module universally that can cover all situations.
Running a recommendation engine that treats everyone alike is essentially giving up business opportunities. Getting from generic to personal isn't just improving the look of the shopfront; it's one of the few straightforward, reliable ways by which an "analytics" platform can actually result in more income for the business.
Sign #6: You Can't Connect Campaign Spend to Actual Revenue
Most retail teams are aware that their email open rates are low. Not many, though, can figure out if a specific SMS campaign indeed led to a concrete sale three days later, just because a campaign's open rate and a store's revenue belong to different systems that were not set up for data exchange with each other.
The Gap Between Campaign Analytics And Attribution
After launching the campaign, one might look at metrics like open rate and find that numbers are encouraging; click-through rates might also be reasonably high, with all indicators of a successful campaign. This, however, does not resolve the one real question relevant to the revenue: did anyone buy due to the campaign? Ordinary campaign reporting focuses on engagement only; it reveals that a message has landed, but does not tell the entire story about the following actions.
Attribution reporting is a completely different ball game: it is about pinpointing a particular campaign to a particular sale, and even if the transaction occurs a few days later.
Without that layer, marketing teams end up defending channel spend with engagement metrics that look good on a slide but don't actually prove the campaign paid for itself.
What Proper Attribution Looks Like
Getting rid of that gap requires a complete understanding of the journey a message takes from delivery to customer purchase. It is no longer enough to focus on metrics like whether someone opened the message, but one should be interested in the time it took before the customer makes a transaction, and be certain that the purchase is attributable to the message, not just assumed. If this is the case, then such methods are effective across all retailers' communication means (e.g., SMS, e-mail, WhatsApp) presented in one integrated report instead of separate reports for each channel without the ability to identify the channel contributing more revenue.
What Enterprise Retailers Build Instead
Six different symptoms, one underlying cause: analytics built for a smaller, simpler version of the business, running underneath a business that's outgrown it. Fixing any one sign in isolation just moves the workaround somewhere else. Fixing the actual ceiling means changing the architecture underneath all six.
That architecture has a few consistent pieces, regardless of vendor. A unified customer data platform retail layer resolves identity across POS, loyalty, and e-commerce into one profile instead of three fragments. A real-time behavioral pipeline replaces nightly batch jobs, so segments and triggers reflect what a customer is doing now, not what they did last week. Integrated campaign execution ties every channel email, SMS, messaging apps into one system that can trace a message to the revenue it produced. And an anomaly detection layer sits underneath all of it, watching for the kind of irregularities that standard sales reporting was never built to catch.
None of this lives in a single off-the-shelf module. It requires an enterprise retail data platform built to sit across a retailer's full stack — CRM, ERP, POS, call centers, accounting systems, and the online shop — rather than one that only sees whichever piece it was installed on top of."
Evinent Analytics is a product that was built with that in mind. It is the one that links up with CRM, ERP, call centers, accounting systems, and online shops, and that covers the six gaps mentioned above: identity, real-time segmentation, native correlation analysis, fraud detection, personalized recommendations, and campaign attribution through one platform instead of six separate ones.
How Evinent Analytics Addresses All Six
At this point, the overall structure is quite similar for the three pairs of signs:
The traditional retail analytics packages mainly show what has already happened, without trying to identify the source, take immediate action, or detect the things that a standard dashboard never could show. Filling in this deficiency is more than just putting in another layer on top of your existing stack; it's more of a platform that allows you to handle all those aspects in which enterprise retailers are actually running their businesses and are facing a lot of problems.
Evinent Analytics has been designed to work within exactly that complexity. If you put them next to each other, the six signals and the functions that resolve them match each other almost perfectly:
Sign | Evinent Analytics Capability |
#1 — Broken identity across channels | Identity stitching — auto-matches anonymous behavior to a known profile |
#2 — Week-old segments | Real-time RFM segmentation |
#3 — Team exports to Excel | Native correlation and time-dependency analysis |
#4 — Fraud invisible until it costs money | Anomaly and outlier detection module |
#5 — Generic recommendations | 9 personalized recommendation block types |
#6 — Campaign spend disconnected from revenue | Campaign attribution with time-to-purchase tracking |
The product's capabilities extend further as the platform connects directly with CRM, ERP, call centers, accounting systems, and online shops, meaning it is compatible with the tools a retailer already uses, without their having to redo everything.
Evinent has been building analytics for retail chains for over a decade, including an 8-year partnership with Sulpak, one of the region's largest electronics retailers, and operates under ISO 9001 standards for quality management.
An organization whose analytical toolset is lagging may be seeing two or three of these symptoms happening to it at the same time: a team silently exporting the data to Excel, segmentation features that are slow in updating, and recommendation blocks that treat each visitor the same. Those six complaints are not different things. Rather, they are indicative of an old platform that was good for a smaller, simpler version of the business and is currently still the one running underneath a business that's outgrown it.
The fix isn't a workaround, a plugin, or a new dashboard bolted onto the old system. It's an analytics layer built from the start to handle identity across channels, react in real time, and connect what customers do to what the business actually earns. That's the gap Evinent Analytics was built to close — not as an add-on to an existing stack, but as the layer underneath it.

FAQ
When should a retailer switch from Google Analytics to a dedicated customer analytics platform?
Eventually, the decision to switch is made once GA4 has ceased being the source of the really important insights, usually at the time a retailer is trying to join customer behaviors between online and offline touchpoints, making use of customer data instantly, or wanting to dive into analysis that is going beyond session data. GA4 is good at device and session tracking, but the technology behind the scenes doesn't enable the resolution of who a customer is as he/she interacts through a phone device, POS terminal, and a loyalty card.
What is the difference between retail analytics software and a customer data platform?
Retail analytics software enterprise typically focuses on reporting: sales trends, traffic, conversion rates, broken down by store or channel. A customer data platform (CDP) goes a layer deeper. It unifies individual customer profiles across every touchpoint into one record, so segmentation, personalization, and campaigns can be built on a single, complete view of each customer rather than fragmented channel data.
How do enterprise retailers track customers across online and offline channels?
This requires matching anonymous online behavior to a known customer profile at the moment of identification, such as a login, a loyalty card scan, or an email opt-in, and then keeping that profile updated as the same person moves between web, app, and in-store purchases. Without this identity resolution layer, POS, e-commerce, and loyalty systems each see a different, incomplete version of the same customer.
What does real-time customer segmentation retail mean?
A customer's segment (e.g., active, at-risk, churned, or high-value) means continuously updating a customer's segment with a new change in their behaviour, rather than waiting for nightly or weekly batch jobs. A change in customer segment that is implemented in a real-time system means a customer can be targeted the very minute their behavior becomes different, whereas if you rely on a batch system, you might not get notified of the change until a day later or more, when it is too late to do anything about the change.
How can retail analytics software connect marketing campaigns to actual sales revenue?
This involves keeping track of which messages were responsible for the purchase at different levels, not only noting that an email was opened, but also determining if and when this specific email caused a transaction. Such data is collected over channels like email, SMS, messenger apps, etc., which a retailer may use, in a single consolidated view rather than each channel separately reporting the levels of engagement.
Key Takeaways
A retail analytics platform hitting its ceiling doesn't look like an outage. It looks like teams quietly building workarounds around what the tool can't do, until those workarounds become the normal workflow.
Fragmented customer identity across channels leads to the same individual appearing three times as separate entries (mobile session, loyalty card, email) rather than being shown as one whole picture.
Segments with batch updates have a real financial impact. A "churning" customer segment, for example, that's already a week old would result in campaigns launching days after the timing that would have made the biggest difference.
Excel exports done manually are the obvious indication that a platform's capabilities have reached a limit; they usually come when a team has to manually recreate the response because the tool can't perform the analysis directly.
Fraud often hides in patterns, not transactions. A single sale rarely looks wrong, but a store's numbers not matching its foot traffic is a signal standard reporting was never built to catch.
Generic recommendation blocks leave revenue on the table. The gap between "customers also bought" and individual, behavior-based recommendations is measurable, not cosmetic.
Campaign engagement isn't the same as campaign revenue. Knowing a message was opened doesn't prove it drove a sale; that requires tracing delivery through to the actual transaction.
Fixing any one of these signs in isolation just relocates the workaround. The real fix is architectural, meaning a unified customer data layer, real-time behavioral pipeline, and integrated attribution built to sit across a retailer's full stack instead of being bolted onto it.
Share